Real-time network flow analysis with interactive Sankey diagrams showing traffic between sources, applications and destinations.
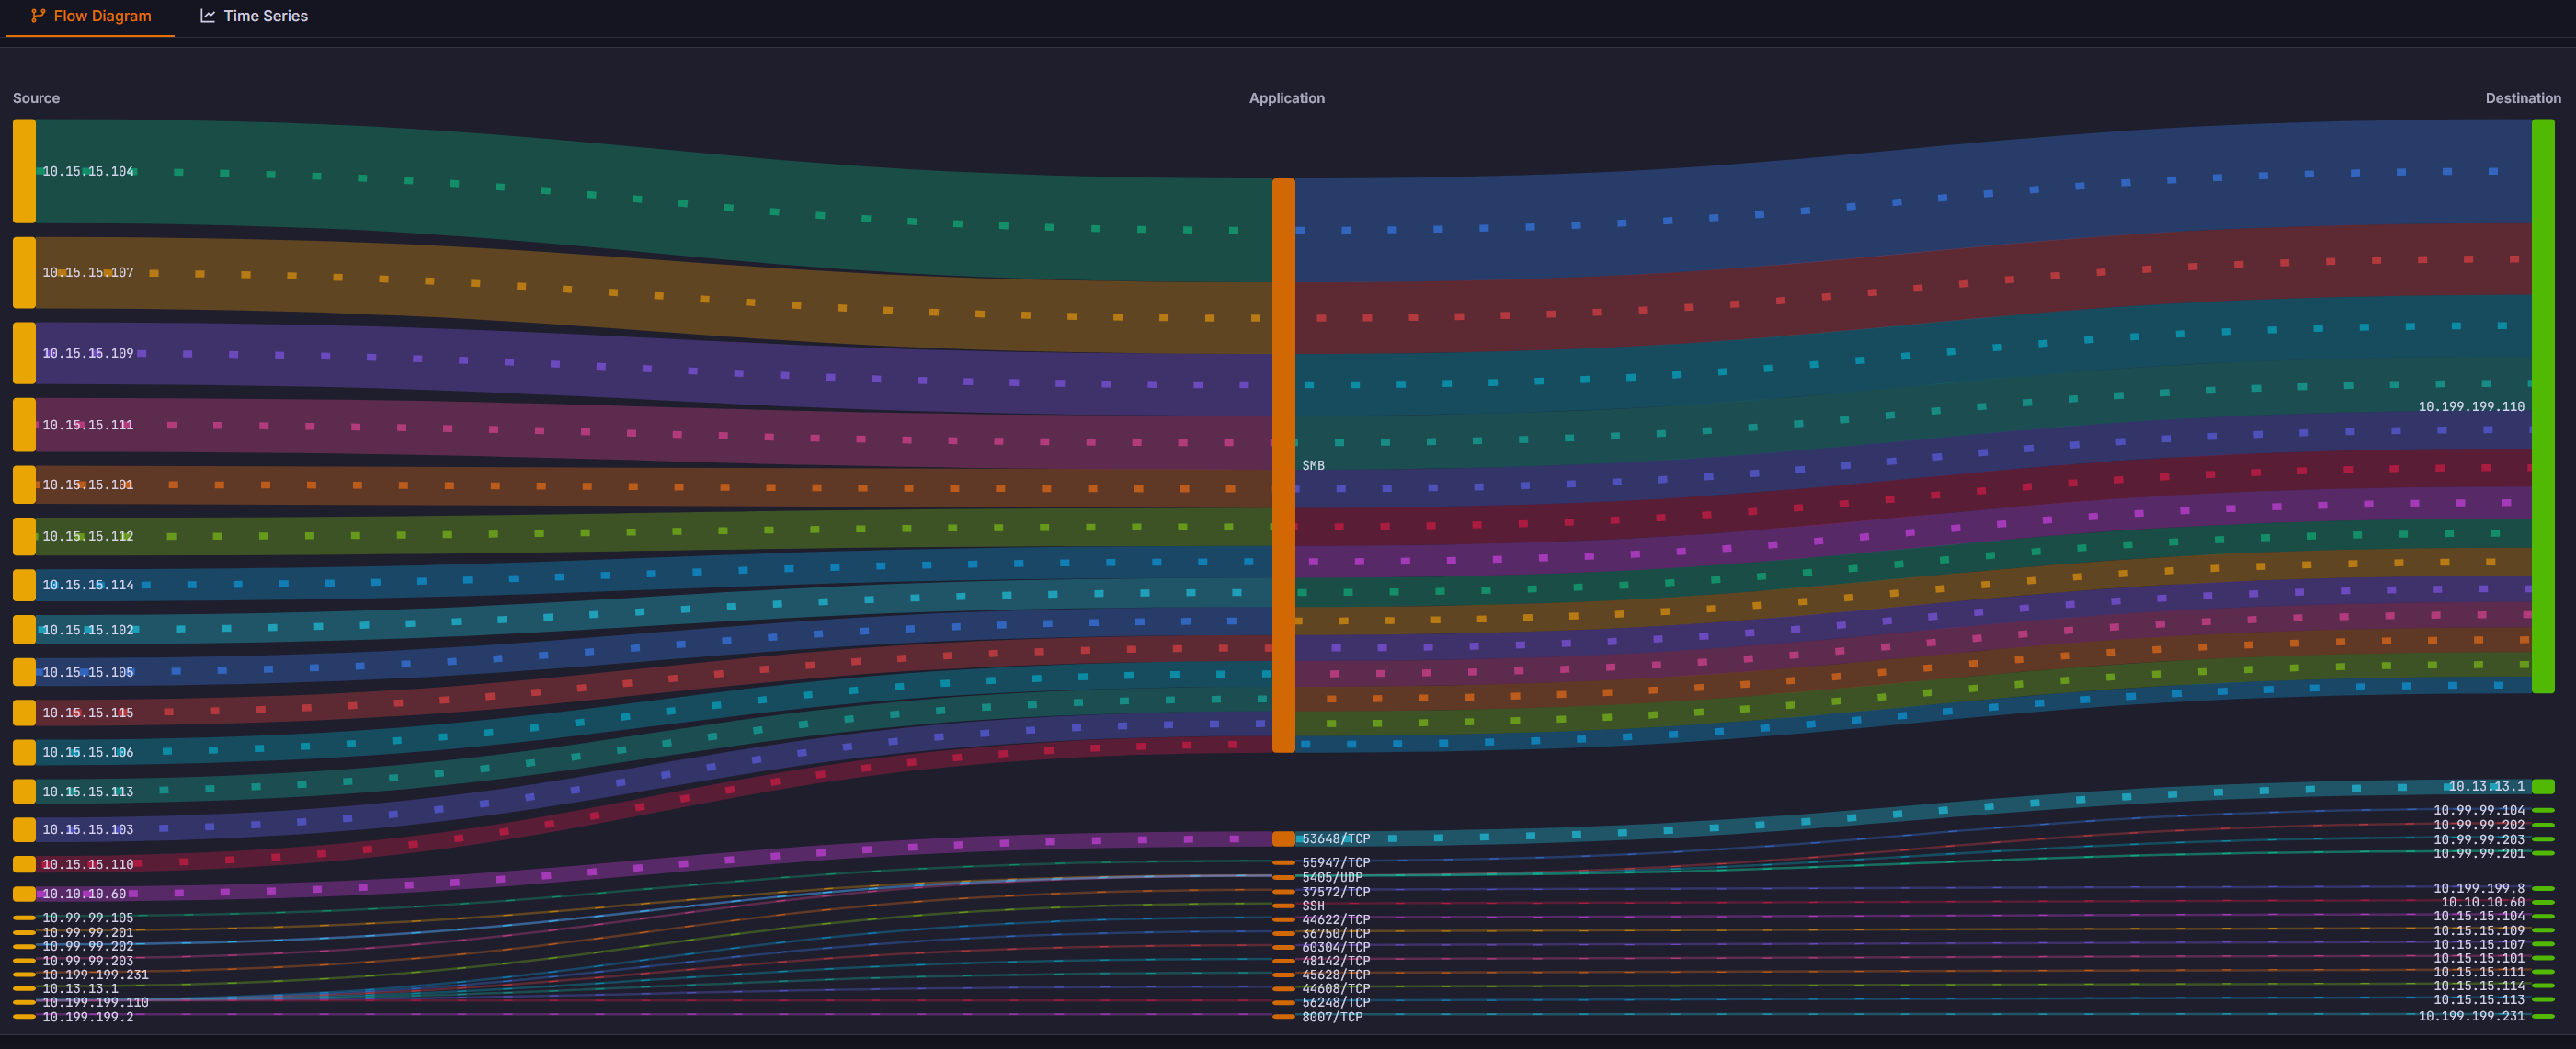
Visualize your network traffic with stunning Sankey diagrams that map connections from source IPs through application protocols to destination hosts. Instantly understand who is talking to whom and over which protocols — SMB, SSH, TCP ports and more.
Switch between flow diagrams and time series views to analyze traffic trends over time. Identify peak usage periods, detect sudden spikes and correlate network events with infrastructure changes across your Proxmox clusters.
Gain deep insight into which applications and protocols consume your bandwidth. sFlow monitoring identifies traffic by application layer — from well-known services like SMB and SSH to custom TCP/UDP ports — so you can make informed capacity decisions.
Quickly spot unexpected traffic patterns, rogue connections or bandwidth hogs. Cross-reference flow data with your Proxmox VM inventory to pinpoint which workloads generate unusual traffic and take corrective action before it impacts performance.
Deploy ProxCenter in seconds with a single command.